Translations:WB-MAI11 Modbus Analog Inputs/7/en
Connection diagrams
The module is made in a plastic case and is designed for installation in a mounting box on a DIN rail.
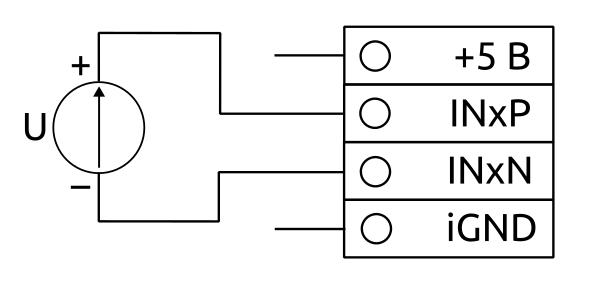
Fig. 1 shows the connection diagram of the sensor with the output type "voltage" in differential mode. This scheme is suitable for sensors whose output voltage can take negative values. Allows you to measure voltages from -5 to 5 V.
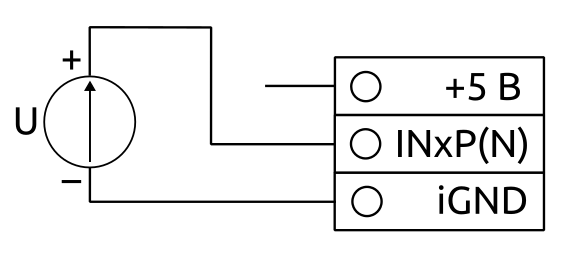 Fig. 2 shows the voltage measurement circuit relative to the common wire. This scheme allows you to measure only positive voltages from 0 to 5 V. It is possible to connect two sensors to one input.
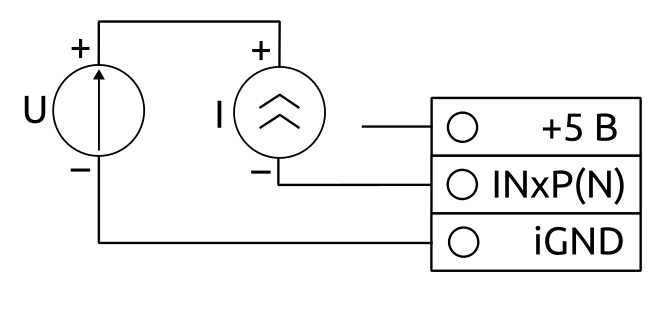 Fig.3 shows the connection diagram of sensors with a current output of 0-20 mA (4-20 mA). Load resistors with a nominal value of 100 Ω built in the device and connect via the software, the configuration process of the device. It is possible to connect two sensors to one input.
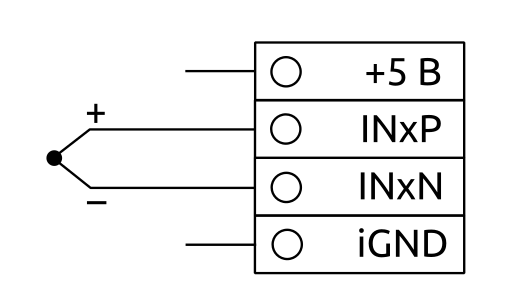 Fig. 4 shows the K-type thermocouple connection diagram. For correct detection of the absence of thermocouple input filter capacitors are discharged short-term (several µs) pulses with built-in resistors 100 Ohms. It is necessary to keep this in mind, if you connect another source of EMF instead of a thermocouple. The capacitors are only discharged in the "Standard sensors" mode when one of the supported thermocouples is selected. In basic modes, no discharge is performed.
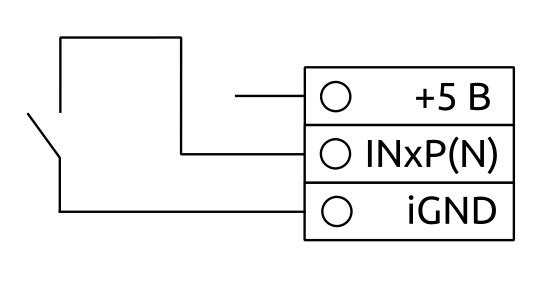 For rice. 5 shows the connection diagram of the sensors of the dry contact or resistance measurement on a two-wire circuit (shown by the dotted line). When using a two-wire circuit, the resistance of the wires is included in the measurement result. Due to the internal features of the INxP input device, the accuracy of the resistance measurement is greater than that of the INxN inputs. This should be taken into account when connecting the sensors. It is possible to connect two sensors to one input.
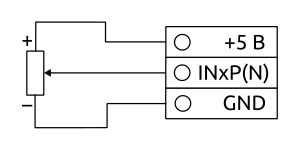 Fig. 6 is the scheme of connection of ratiometric sensors or variable resistors. In this mode, the signal from the sensor is measured as a percentage - from 0% (GND level) to 100% (+5V level). It is possible to connect two sensors to one input.
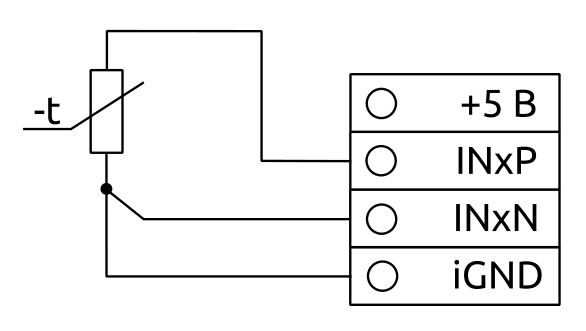 Fig. 7 shows a diagram of the resistance measurement of the three-wire circuit. In this mode, the resistance of the wires has almost no effect on the measurement result, provided that all the wires to the sensor are the same. The absolute effect of wire resistance on the final result is 0.003 Rw as opposed to 2Rw (Rw is the resistance of one wire to the sensor) in a two-wire circuit.
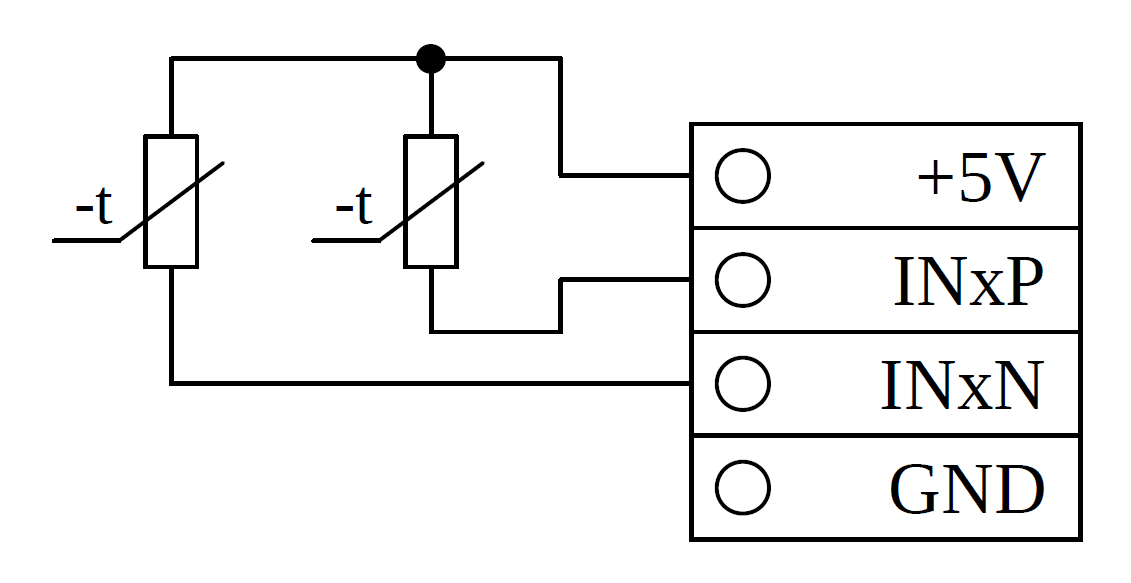 Fig. 8 shows a diagram of the resistance measurement using the current measurement. This circuit is used to connect an NTC thermistor. In this mode, the device can measure resistance in a wide range - from 150 Ohms to 1 MW. But keep in mind that the lower the resistance of the NTC, the greater the current in the circuit and self-heating NTC (as opposed to the circuits in Fig. 5 and Fig.7, where the current in the circuit is constant regardless of resistance). Therefore, the device artificially reduces the input polling rate depending on the current NTC resistance to compensate for self-heating. It is possible to connect two NTC to one input, but in this case, the polling rate is reduced, because during the survey of one, the current goes through both NTC, which leads to an increase in idle time to compensate for self-heating. To improve the accuracy of high resistance measurements, it is recommended to select the lowest possible data rate - 20 SPS.
