Wiren Board Web Interface/en: различия между версиями
Метки: правка с мобильного устройства правка из мобильной версии |
|||
| (не показано 55 промежуточных версий 2 участников) | |||
| Строка 1: | Строка 1: | ||
<languages/>{{DISPLAYTITLE: Web Interface of Wiren Board Controllers}} | <languages/>{{DISPLAYTITLE: Web Interface of Wiren Board Controllers}} | ||
== General information == | == General information == | ||
{{ | {{Anchor|features}} | ||
Wiren Board controllers have a built-in web interface that allows you to perform most of the tasks for configuring the controller, firmware and connected devices. The source code is open and available in [https://github.com/wirenboard/ our repository]. | Wiren Board controllers have a built-in web interface that allows you to perform most of the tasks for configuring the controller, firmware and connected devices. The source code is open and available in [https://github.com/wirenboard/ our repository]. | ||
| Строка 12: | Строка 12: | ||
{{Wbincludes:How to enter}} | {{Wbincludes:How to enter}} | ||
== | == Change access level == | ||
{{Anchor|change-access-level}} | {{Anchor|change-access-level}} | ||
{{Wbincludes:WebUI Change Access Level}} | {{Wbincludes:WebUI Change Access Level}} | ||
| Строка 19: | Строка 19: | ||
{{Anchor|webui}} | {{Anchor|webui}} | ||
[[Image: Web-Configs-2.0 webui.png |300px|thumb|right| Web interface settings ]] | [[Image: Web-Configs-2.0 webui.png |300px|thumb|right| Web interface settings ]] | ||
In the '''Settings''' → '''Web | In the '''Settings''' → '''Web UI''' section, you can configure the connection to the MQTT broker, select a panel for the home page and change the language of the web interface. | ||
The web interface does not support user authorization, but you can configure nginx server http authorization. For detailed instructions, see [[WebUI_Password| Protecting the web interface of the controller with a password]]. | The web interface does not support user authorization, but you can configure nginx server http authorization. For detailed instructions, see [[WebUI_Password| Protecting the web interface of the controller with a password]]. | ||
== List of devices == | == List of devices == | ||
{{ | {{Anchor|devices}} | ||
The '''Devices''' page contains virtual representations of devices physically connected to the controller or virtual devices created by [[wb-rules]] scripts. | The '''Devices''' page contains virtual representations of devices physically connected to the controller or virtual devices created by [[wb-rules]] scripts. | ||
Each device is represented by a card that contains device channels - controls. If you click on the name of the control, you will get a path like <code>device/control</code>, which can be used when writing scripts on wb-rules. | |||
Do not use this page to manage your automation system, there are dashboards for that. | |||
<gallery mode="packed" heights="150px"> | |||
Image: Web-Devices-2.0.png | List of devices connected to the controller | |||
Image: Web-Devices-Delete-Device-2.0.png | Removing a device card | |||
</gallery> | |||
== Dashboards and widgets == | |||
{{Anchor|dashboards-and-widgets}} | {{Anchor|dashboards-and-widgets}} | ||
=== | ===Panels=== | ||
{{Anchor|dashboards}} | {{Anchor|dashboards}} | ||
You can create text and graphic SVG dashboards to display data and control your automation system. | |||
The text dashboard consists of widgets, and the graphic panel consists of a background image with bindings to the MQTT channels of the controller. [[SVG-Dashboards | How to make an SVG panel]]. | |||
< | <gallery mode="packed" heights="150px"> | ||
Image: Web-Dashboards-2.0.png | Dashboards list | |||
</ | Image: Text-Dashboard Example.png | Dashboard | ||
Image: SVG-Dashboard Example.png | SVG Dashboard | |||
</gallery> | |||
=== Widgets === | === Widgets === | ||
{{Anchor|widgets}} | |||
With the help of widgets, it is convenient to combine controls of different devices by meaning or location. For example, you can make a widget to control the lighting in a bedroom, or a climate widget in a store. Widgets are grouped into dashboards, one widget can be added to several dashboards. | |||
Widgets | You can create widgets in the '''Widgets''' section, or directly from the dashboard. There is a visual designer and a JSON editor. | ||
< | <gallery mode="packed" heights="150px"> | ||
=== | Image: webui-widgets.png | Widget List | ||
{{Anchor| | Image: widget-create-1.png | Creating a new widget from a dashboard | ||
Image: widget-create-2.png | Widget constructor | |||
</ | Image: widget-create-2.2.png | JSON view | ||
Image: widget-create-3.png | Ready widget | |||
Image: widget-create-4.png | Edit buttons | |||
</gallery> | |||
=== Kiosk mode === | |||
{{Anchor|kiosk}} | |||
{{SupportedSinceRelease|en=true | |||
| release = wb-2207 | |||
|content= | |||
If you use a regular tablet as a control panel and display the controller's web interface on it, then it will be useful to hide unnecessary elements and the browser window: | |||
# Open the text or SVG dashboard and click the '''Enter fullscreen mode''' button. | |||
# Copy the URL bar in the address bar of the browser, at the end there should be a <code>?fullscreen</code> parameter. | |||
# Start a browser without panels: | |||
#* On computers and tablets with Windows/linux OS, launch the browser in kiosk mode and pass it the panel URL parameter, examples: | |||
#*:<syntaxhighlight lang="bash"> | |||
irefox -kiosk 'http://wirenboard-ascmdm6q.local/#!/dashboards/dashboard1?fullscreen' | |||
chromium -kiosk 'http://wirenboard-ascmdm6q.local/#!/dashboards/dashboard1?fullscreen' | |||
</syntaxhighlight> | |||
#* On Android tablets, use dedicated browser versions such as Fully Kiosk Browser | |||
This works for all dashboard types. | |||
<gallery mode="packed" heights="150px"> | <gallery mode="packed" heights="150px"> | ||
Image: | Image: Text-Dashboard full screen.png | Enter to full screen mode | ||
Image: | Image: Text-Dashboard full screen 2.png | Full screen mode | ||
Image: Text-Dashboard full screen 3.png | Kiosk mode | |||
Image: | |||
</gallery> | </gallery> | ||
}} | |||
== History == | |||
{{Anchor|history}} | {{Anchor|history}} | ||
[[Image: Web-History-Web-2.0 channel.png | [[Image: Web-History-Web-2.0 channel.png |300px|thumb|right| Button to go to the measurement history ]] | ||
By default, the standard controller software stores all received data, which you can view in the form of graphs or tables. The data can be uploaded to csv, to do this, click on the button below the graph, or use the [https://github.com/wirenboard/wb-mqtt-db-cli wb-mqtt-db-cli] utility. | |||
[ | |||
To view the history, go to the '''History''' section and select the desired channels, or hover over the widget's channel and click the histogram button. | |||
Display options: | |||
* choice of period; | |||
* | * simultaneous viewing of several channels; | ||
* | * scaling; | ||
* | * taking a screenshot; | ||
* | * cursor measurements. | ||
* | |||
If you need more features, you can set up automatic data export to [[Grafana]]. | |||
<gallery mode="packed" heights="100px"> | <gallery mode="packed" heights="100px"> | ||
Image: Web-History-Web-2.0.png | | Image: Web-History-Web-2.0.png | Schedule | ||
Image: Web-History-Web-2.0 1.png | | Image: Web-History-Web-2.0 1.png | Table View | ||
Image: Web-History-Web-2.0 2.png | | Image: Web-History-Web-2.0 2.png | Data uploaded to CSV | ||
Image: Web-History-Web-2.0 3.png | | Image: Web-History-Web-2.0 3.png | Setting up history storage | ||
</gallery> | </gallery> | ||
== Automation scripts == | |||
{{Anchor|rules}} | {{Anchor|rules}} | ||
The controller's web interface has a script editor [[wb-rules]] that allows you to create, edit, and delete rules. If there are errors in the script, the editor will inform you about it and indicate the place in the script. | |||
The editor is available in the '''Rules''' section. | |||
<gallery mode="packed" heights="150px"> | <gallery mode="packed" heights="150px"> | ||
Image: Web-Rules-2.0.png | | Image: Web-Rules-2.0.png | Script editor | ||
Image: Web-Rules-2.0 errors.png | | Image: Web-Rules-2.0 errors.png | Error highlighting | ||
</gallery> | </gallery> | ||
== Configuring the controller and connected devices == | |||
{{Anchor|settings}} | {{Anchor|settings}} | ||
[[Image: Web-Configs-2.0.png |300px|thumb|right| | [[Image: Web-Configs-2.0.png |300px|thumb|right| Configuration files ]] | ||
The Wiren Board controller runs on Linux, so almost all settings are stored in configuration files. Files can be edited via [[SSH]] or using the web configurator. | |||
The list of available settings can be found in the section '''Settings''' → '''Confgs'''. | |||
For example, via the web interface, you can configure: connected [[RS-485:Configuration via Web Interface| Modbus devices]], gateways [[KNX | KNX]] and [[Modbus RTU/TCP Slave]] and other parameters. | |||
== Event notifications == | |||
{{Anchor|alarms}} | {{Anchor|alarms}} | ||
In the web interface of the controller, you can configure the event notification to be sent via SMS or Email, for example, when an alarm is triggered in the [[WB-MWAC Modbus Water Consumption Metering and Leak Monitoring| WB-MWAC]], send an SMS to the specified number. [[Notification module | Notification module settings]]. | |||
You can also send notifications to Telegram, for this you need to write a small script on wb-rules, [[Rule_Examples#telegram | example]]. | |||
== Firmware update and collect diagnostic data == | |||
{{Anchor|diagnostic}} | {{Anchor|diagnostic}} | ||
[[Image: Web-Configs-2.0 system.png |300px|thumb|right| | [[Image: Web-Configs-2.0 system.png |300px|thumb|right| Updating software and downloading diagnostics ]] | ||
You can update the controller software without access to the Internet through the web interface, for this you will need a computer and a pre-loaded firmware fit-file. For more information about updating the controller software, see [[Wiren Board Firmware Update| instruction]]. | |||
If the controller works with errors, then when contacting technical support, we recommend uploading a diagnostic archive - this will help us quickly understand the problem. If for some reason you cannot upload the archive from the web interface, use the console utility [https://github.com/wirenboard/wb-diag-collect wb-diag-collect]. | |||
== View MQTT channels and syslog == | |||
{{Anchor|mqtt-channels}} | {{Anchor|mqtt-channels}} | ||
The list of MQTT channels is useful when troubleshooting, or when setting up integration with third-party software, such as [[Rapid SCADA]] or [[Home Assistant]]. The list is available in the section '''Settings''' → '''MQTT channels'''. | |||
The Linux system log can be viewed using the [[journalctl]] utility or in the controller web interface in the '''Settings''' → '''Logs''' section. | |||
<gallery mode="packed" heights="120px"> | <gallery mode="packed" heights="120px"> | ||
Image:Web-Configs-2.0 mqtt.png| MQTT | Image:Web-Configs-2.0 mqtt.png| MQTT channels | ||
Image:Web-Configs-2.0 logs.png| | Image:Web-Configs-2.0 logs.png| Logs | ||
</gallery> | |||
== Phone control == | |||
{{Anchor|mobile}} | |||
The web interface adapts to the screen size, so you can control the automation system from a mobile device or tablet. | |||
An alternative would be to use third-party applications: [[MQTT_Dash]], [[Home Assistant]], [[Apple HomeKit|Apple Home]] and others, see [[Supported_devices |table of supported devices and programs]] for a complete list. | |||
<gallery mode="packed" heights="350px" caption="Phone controller web interface"> | |||
Image: web-ui mobile 1.png | Device List | |||
Image: web-ui mobile 2.png | Side panel | |||
Image: web-ui mobile 5.png | SVG dashboard | |||
Image: web-ui mobile 3.png | Viewing the system log | |||
Image: web-ui mobile 4.png | Modbus device setup | |||
</gallery> | </gallery> | ||
== Previous version == | |||
* [[Wiren_Board_Web_Interface 1.0| Wiren Board Web Interface 1.0]], replaced by 2.0 in early 2021. | |||
* [[Wiren_Board_Web_Interface 1.0| | |||
Текущая версия на 14:05, 3 августа 2022
General information
Wiren Board controllers have a built-in web interface that allows you to perform most of the tasks for configuring the controller, firmware and connected devices. The source code is open and available in our repository.
nginx works as a web server, the site interacts with MQTT via WebSocket.
Overview of the web interface of Wiren Board controllers.
How to enter the web interface
To access the Web Interface of a Wiren Board controller, connect to the controller via Wi-Fi or Ethernet and enter IP address of the controller into the browser's address bar.
If you are on the same network as the controller and use Apple devices, a computer with Linux or Windows 10 and higher, then you can use mDNS instead of an IP address: enter http://wirenboard-XXXXXXXX.local into the address bar, where ХХХХХХХХ — eight-digit serial number of the controller.
Также доступ можно получить через Wiren Board Cloud, если контроллер к нему подключен.
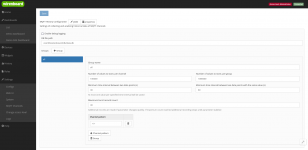
Change access level

To change the settings of the controller, you need the Administrator access level, which can be set in the Settings → Permissions section.
After completing the settings, we recommend that you set the access level to User or Operator - this will help you avoid making random mistakes when working with the web interface every day.
MQTT connection setup and language selection

In the Settings → Web UI section, you can configure the connection to the MQTT broker, select a panel for the home page and change the language of the web interface.
The web interface does not support user authorization, but you can configure nginx server http authorization. For detailed instructions, see Protecting the web interface of the controller with a password.
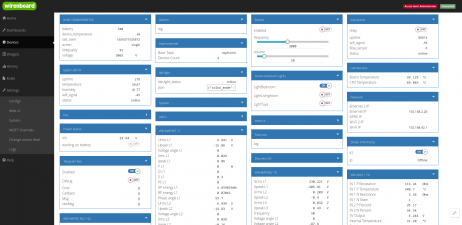
List of devices
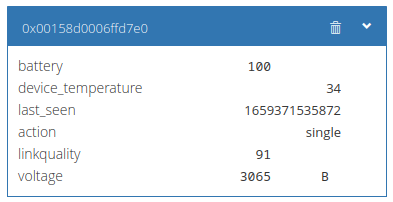
The Devices page contains virtual representations of devices physically connected to the controller or virtual devices created by wb-rules scripts.
Each device is represented by a card that contains device channels - controls. If you click on the name of the control, you will get a path like device/control, which can be used when writing scripts on wb-rules.
Do not use this page to manage your automation system, there are dashboards for that.
List of devices connected to the controller
Removing a device card


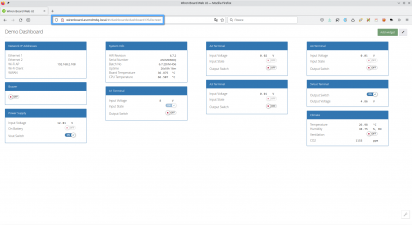
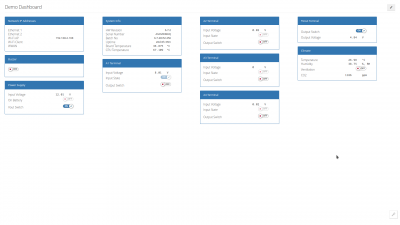
Dashboards and widgets
Panels
You can create text and graphic SVG dashboards to display data and control your automation system.
The text dashboard consists of widgets, and the graphic panel consists of a background image with bindings to the MQTT channels of the controller. How to make an SVG panel.
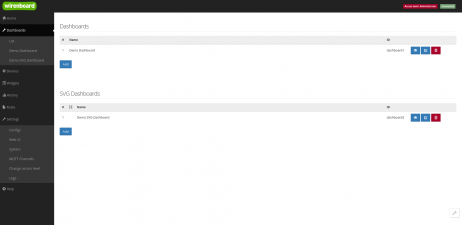
Dashboards list
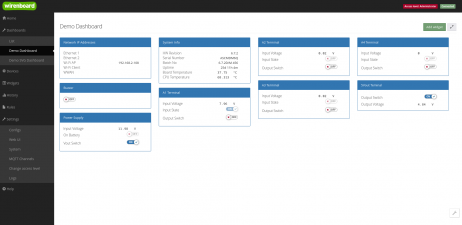
Dashboard
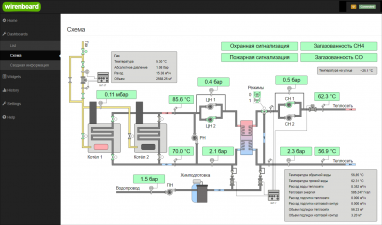
SVG Dashboard


Widgets
With the help of widgets, it is convenient to combine controls of different devices by meaning or location. For example, you can make a widget to control the lighting in a bedroom, or a climate widget in a store. Widgets are grouped into dashboards, one widget can be added to several dashboards.
You can create widgets in the Widgets section, or directly from the dashboard. There is a visual designer and a JSON editor.
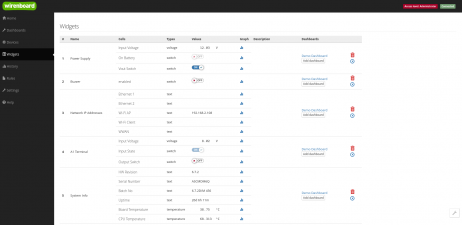
Widget List
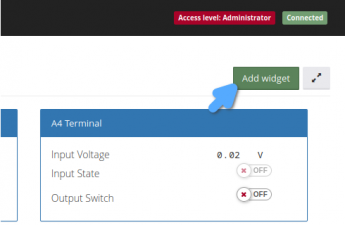
Creating a new widget from a dashboard
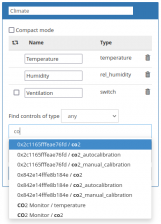
Widget constructor
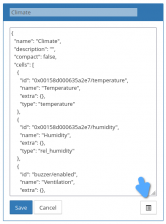
JSON view
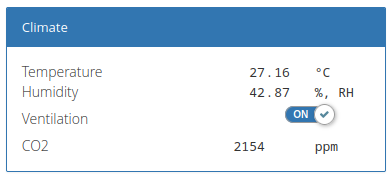
Ready widget
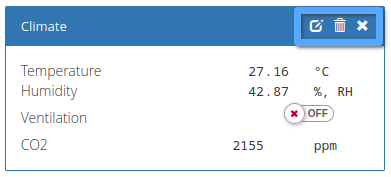
Edit buttons


Kiosk mode
If you use a regular tablet as a control panel and display the controller's web interface on it, then it will be useful to hide unnecessary elements and the browser window:
- Open the text or SVG dashboard and click the Enter fullscreen mode button.
- Copy the URL bar in the address bar of the browser, at the end there should be a
?fullscreenparameter. - Start a browser without panels:
- On computers and tablets with Windows/linux OS, launch the browser in kiosk mode and pass it the panel URL parameter, examples:
irefox -kiosk 'http://wirenboard-ascmdm6q.local/#!/dashboards/dashboard1?fullscreen'
chromium -kiosk 'http://wirenboard-ascmdm6q.local/#!/dashboards/dashboard1?fullscreen'
- On Android tablets, use dedicated browser versions such as Fully Kiosk Browser
- On computers and tablets with Windows/linux OS, launch the browser in kiosk mode and pass it the panel URL parameter, examples:
This works for all dashboard types.
Enter to full screen mode
Full screen mode
Kiosk mode


History

By default, the standard controller software stores all received data, which you can view in the form of graphs or tables. The data can be uploaded to csv, to do this, click on the button below the graph, or use the wb-mqtt-db-cli utility.
To view the history, go to the History section and select the desired channels, or hover over the widget's channel and click the histogram button.
Display options:
- choice of period;
- simultaneous viewing of several channels;
- scaling;
- taking a screenshot;
- cursor measurements.
If you need more features, you can set up automatic data export to Grafana.
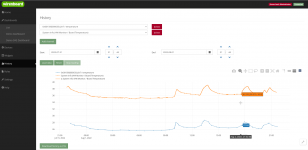
Schedule
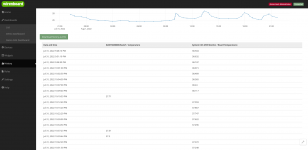
Table View
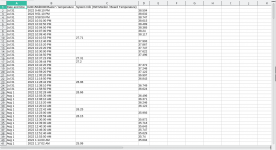
Data uploaded to CSV
Setting up history storage


Automation scripts
The controller's web interface has a script editor wb-rules that allows you to create, edit, and delete rules. If there are errors in the script, the editor will inform you about it and indicate the place in the script.
The editor is available in the Rules section.
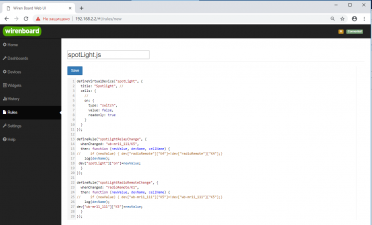
Script editor
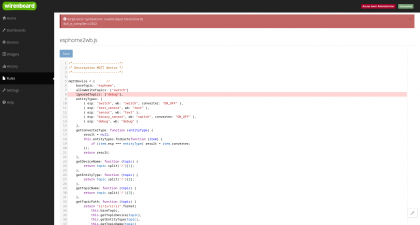
Error highlighting


Configuring the controller and connected devices

The Wiren Board controller runs on Linux, so almost all settings are stored in configuration files. Files can be edited via SSH or using the web configurator.
The list of available settings can be found in the section Settings → Confgs.
For example, via the web interface, you can configure: connected Modbus devices, gateways KNX and Modbus RTU/TCP Slave and other parameters.
Event notifications
In the web interface of the controller, you can configure the event notification to be sent via SMS or Email, for example, when an alarm is triggered in the WB-MWAC, send an SMS to the specified number. Notification module settings.
You can also send notifications to Telegram, for this you need to write a small script on wb-rules, example.
Firmware update and collect diagnostic data

You can update the controller software without access to the Internet through the web interface, for this you will need a computer and a pre-loaded firmware fit-file. For more information about updating the controller software, see instruction.
If the controller works with errors, then when contacting technical support, we recommend uploading a diagnostic archive - this will help us quickly understand the problem. If for some reason you cannot upload the archive from the web interface, use the console utility wb-diag-collect.
View MQTT channels and syslog
The list of MQTT channels is useful when troubleshooting, or when setting up integration with third-party software, such as Rapid SCADA or Home Assistant. The list is available in the section Settings → MQTT channels.
The Linux system log can be viewed using the journalctl utility or in the controller web interface in the Settings → Logs section.
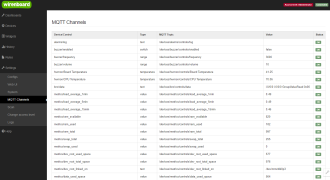
MQTT channels
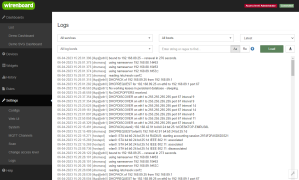
Logs


Phone control
The web interface adapts to the screen size, so you can control the automation system from a mobile device or tablet.
An alternative would be to use third-party applications: MQTT_Dash, Home Assistant, Apple Home and others, see table of supported devices and programs for a complete list.
- Phone controller web interface
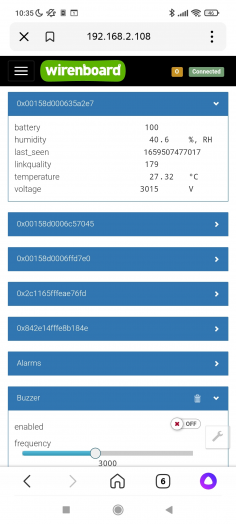
Device List
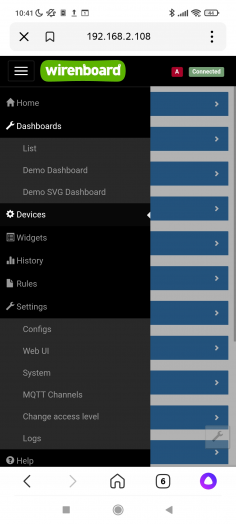
Side panel
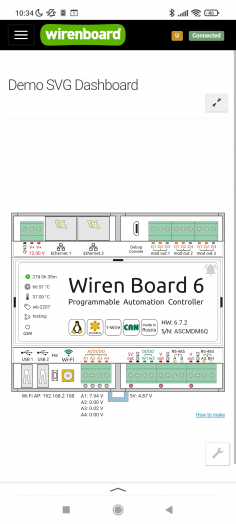
SVG dashboard
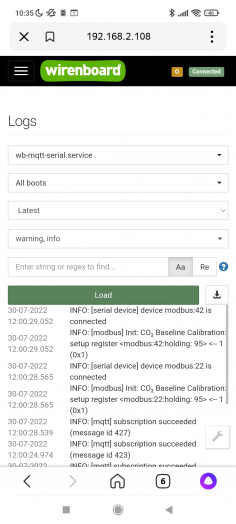
Viewing the system log
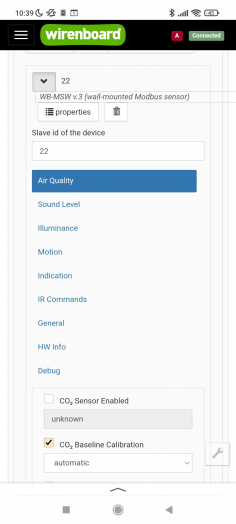
Modbus device setup


Previous version
- Wiren Board Web Interface 1.0, replaced by 2.0 in early 2021.